
|
Be the first user to complete this post
|
Add to List |
Creating an Animated Ring or Pie chart in d3js
 In our previous article, we learnt how to create a simple animated bar graph. In this article, we will tackle something thats a little more interesting - creating a an animated ring. We will follow a step-by-step process to create a simple animated ring whose contents change based upon the options you select from a dropdown.
DEMO
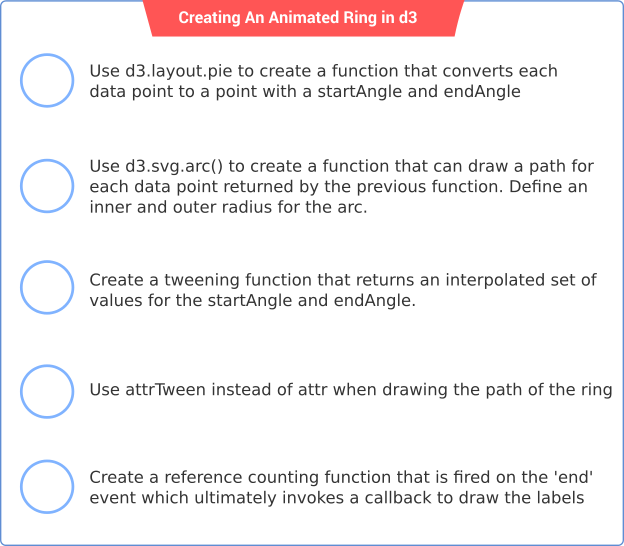
TLDR: These are the major steps towards achieving our goal
In our previous article, we learnt how to create a simple animated bar graph. In this article, we will tackle something thats a little more interesting - creating a an animated ring. We will follow a step-by-step process to create a simple animated ring whose contents change based upon the options you select from a dropdown.
DEMO
TLDR: These are the major steps towards achieving our goal
Data and Dimentions
We begin by creating some variables that will be used by our drawAnimatedRingChart function.// Data: Average age of employees in an organization
var employees = [
{dept: 'A', count : 22},
{dept: 'B', count : 66},
{dept: 'C', count : 25},
{dept: 'D', count : 50},
{dept: 'E', count : 27}
];
var maxWidth = 200;
var maxHeight = 200;
var outerRadius = 100;
var ringWidth = 20;
D3.layout.pie
The main point to remember here is that a ring in d3 is just a variation of the pie chart with the following difference -While a pie chart only requires an outer radius (the inner radius defaulting to 0), a ring has a non-zero value for both - outer radius and inner radius.
That said, lets start defining our function responsible for drawing the ring.
function drawAnimatedRingChart(config) {
    var pie = d3.layout.pie().value(function (d) {
        return d.count;
    });
}
pie function that can extracts the 'count' property of a data array and return a corresponding array of objects with each object having two new attributes - the startAngle and the endAngle. This new array can then be consumed by another function to draw a section of the pie - the arc function.
We need two more functions that will help us draw the actual pie - one to define the colors of our pie chart, the other is our arc function.
var color = d3.scale.category10();
var arc = d3.svg.arc();
arc.outerRadius(config.outerRadius || outerRadius)
        .innerRadius(config.innerRadius || innerRadius);
// Remove the previous ring
d3.select(config.el).selectAll('g').remove();
var svg = d3.select(config.el)
    .attr({
        width : maxWidth,
        height: maxHeight
    });
Drawing the arc
With some initial setup out of the way, its a great time to start drawing our ring. We first create a group for each arc to be drawn.// Add the groups that will hold the arcs
var groups = svg.selectAll('g.arc')
.data(pie(config.data)) // Data binding
.enter()
.append('g')
.attr({
'class': 'arc',
'transform': 'translate(' + outerRadius + ', ' + outerRadius + ')'
});
pie(config.data) when binding our data. We did not directly associate our raw data array employees with the groups, instead we transformed it such that each data point that is bound to the DOM will now posess a startAngle and an endAngle - thanks to the pie function[ Tip: Learn how data binding works in d3 ].
In the next step, we draw the pie and assign it some color.
// Create the actual slices of the pie
groups.append('path')
    .attr({
        'fill': function (d, i) {
            return color(i);
        }
        'd': arc // Use the arc to draw the ring sections
    });
path with an attribute called d. Thats because in order to draw the actual section of a ring, the startAngle and endAngle attributes need to be transformed into svg coordinates in a way that a path can be drawn around it and that task is performed by the pie function.
JSFIDDLE DEMO
Animating the ring
In order to create the animation, we will need tweak our code a bit. First we need to create a function that knows how to generate different values of the end angle for each arc over a period of time. In d3, such functions that generate time dependent values are called interpolators.function tweenPie(finish) {
var start = {
startAngle: 0,
endAngle: 0
};
var interpolator = d3.interpolate(start, finish);
return function(d) { return arc(interpolator(d)); };
}
i that can generate intermediate values between a start and finish object. The arc function then consumes these intermediate values to render the state of the arc over a period of time, thereby causing an animated effect.
Here's how you'd use the tweenPie function.
groups.append('path')
    .attr({
        'fill': function (d, i) {
            return color(i);
        }
    })
    .transition()
    .duration(config.duration || 1000)
    .attrTween('d', tweenPie);
- We invoked a transition function on our selector.
- We specified a duration of the transition.
- Instead of using
attrwe now useattrTweenand pass it ourtweenPiefunction defined earlier
Adding labels
Adding our label to a chart is pretty easy. All you would need to do is add the following snippet.groups.append('text')
.attr({
'text-anchor': 'middle',
'transform': function (d) {
return 'translate(' + arc.centroid(d) + ')';
}
})
.text(function (d) {
// Notice the usage of d.data to access the raw data item
return d.data.dept;
});
d.data because if you remember from earlier d in our case was the output of the pie function.
There is however one problem with the above snippet. The labels dont seem to show up. The reason is that due to the animation in the ring, it gets drawn on top of the labels. To get this working, we will need to draw the lables after the entire animation is complete.
In D3, As of this writing the end event for a transition is fired for each animated item in the selection. So the best way to know when the entire animation is complete is through reference counting. So, we are going to define a little callback function outside of our ring function that we will then bind to the end event of every function to do the counting for us.
// This function helps you figure out when all
// the elements have finished transitioning
// Reference: https://groups.google.com/d/msg/d3-js/WC_7Xi6VV50/j1HK0vIWI-EJ
function checkEndAll(transition, callback) {
var n = 0;
transition
.each(function() { ++n; })
.each("end", function() {
if (!--n) callback.apply(this, arguments);
});
}
function drawAnimatedRingChart(config) {
...
...
groups.append('path')
.attr({
'fill': function (d, i) {
return color(i);
}
})
.transition()
.duration(config.duration || 1000)
.attrTween('d', tweenPie)
.call(checkEndAll, function () {
// Finally append the title of the text to the node
groups.append('text')
    .attr({
        'text-anchor': 'middle',
        'transform': function (d) {
            return 'translate(' + arc.centroid(d) + ')';
        }
    })
    .text(function (d) {
        // Notice the usage of d.data to access the raw data item
        return d.data.dept;
    });
});
}
And thats all there is to it. Found something incorrect or want to see something improved? Let us know in the comments.
Also Read:
- A visual explanation of the Enter, Update and Exit Selections in D3js
- d3 Fundamentals : Understanding domain, range and scales in D3js
- Using d3js to draw a bar chart with an axis and some basic transitions
- Render a d3js Tree as a React Component